How to Analyze Visual Positioning Performance Metric
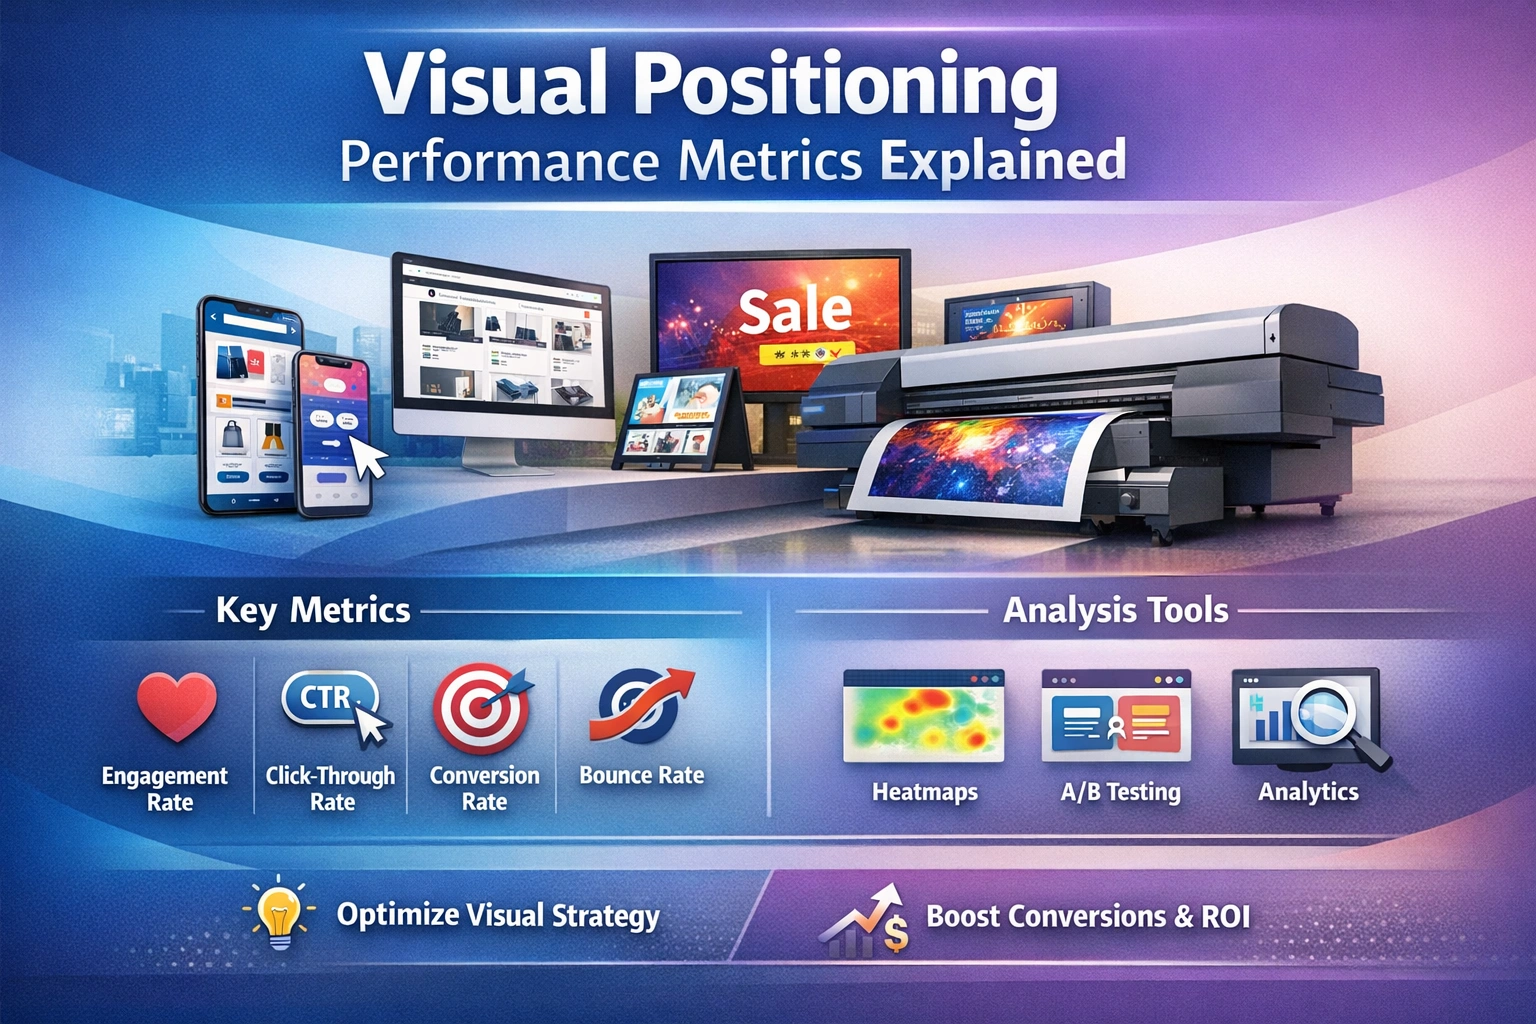
In today's digital landscape, visual content plays a crucial role in marketing, branding, and user engagement. As businesses strive to enhance their online presence, understanding how to analyze **visual positioning performance metrics** becomes essential. This process not only aids in evaluating the effectiveness of visual strategies but also helps in making informed decisions that drive better results.
What is Visual Positioning?
Visual positioning refers to the strategic placement and presentation of visual content, whether images, graphics, or videos, on a website or in marketing materials. It encompasses how these visuals align with branding and customer expectations. Effective visual positioning enhances user experience, captures attention, and ultimately influences purchasing decisions.
Importance of Analyzing Performance Metrics
The analysis of performance metrics helps in understanding how well your visual content is performing in terms of engagement, conversion, and overall effectiveness. By regularly monitoring these metrics, businesses can:
·
Identify the most effective content types and formats.
·
·
Understand audience preferences and behavior.
·
·
Optimize future campaigns based on data-driven insights.
·
·
Enhance return on investment (ROI) through targeted strategies.
·
Key Visual Positioning Performance Metrics
Several performance metrics should be analyzed to gain insights into the effectiveness of your visual positioning. Here are some of the most essential ones:
1. Engagement Rate

Engagement rate tracks how users interact with your visual content. This can include likes, shares, comments, and saves. High engagement rates indicate that your visuals resonate with your audience. Tools like Google Analytics or social media insights can help track this metric.
2. Click-Through Rate (CTR)

The CTR measures the percentage of users who click on your visual elements (like buttons or images) compared to the total number who viewed them. A high CTR suggests that your visuals are effectively enticing users to take action.
3. Conversion Rate
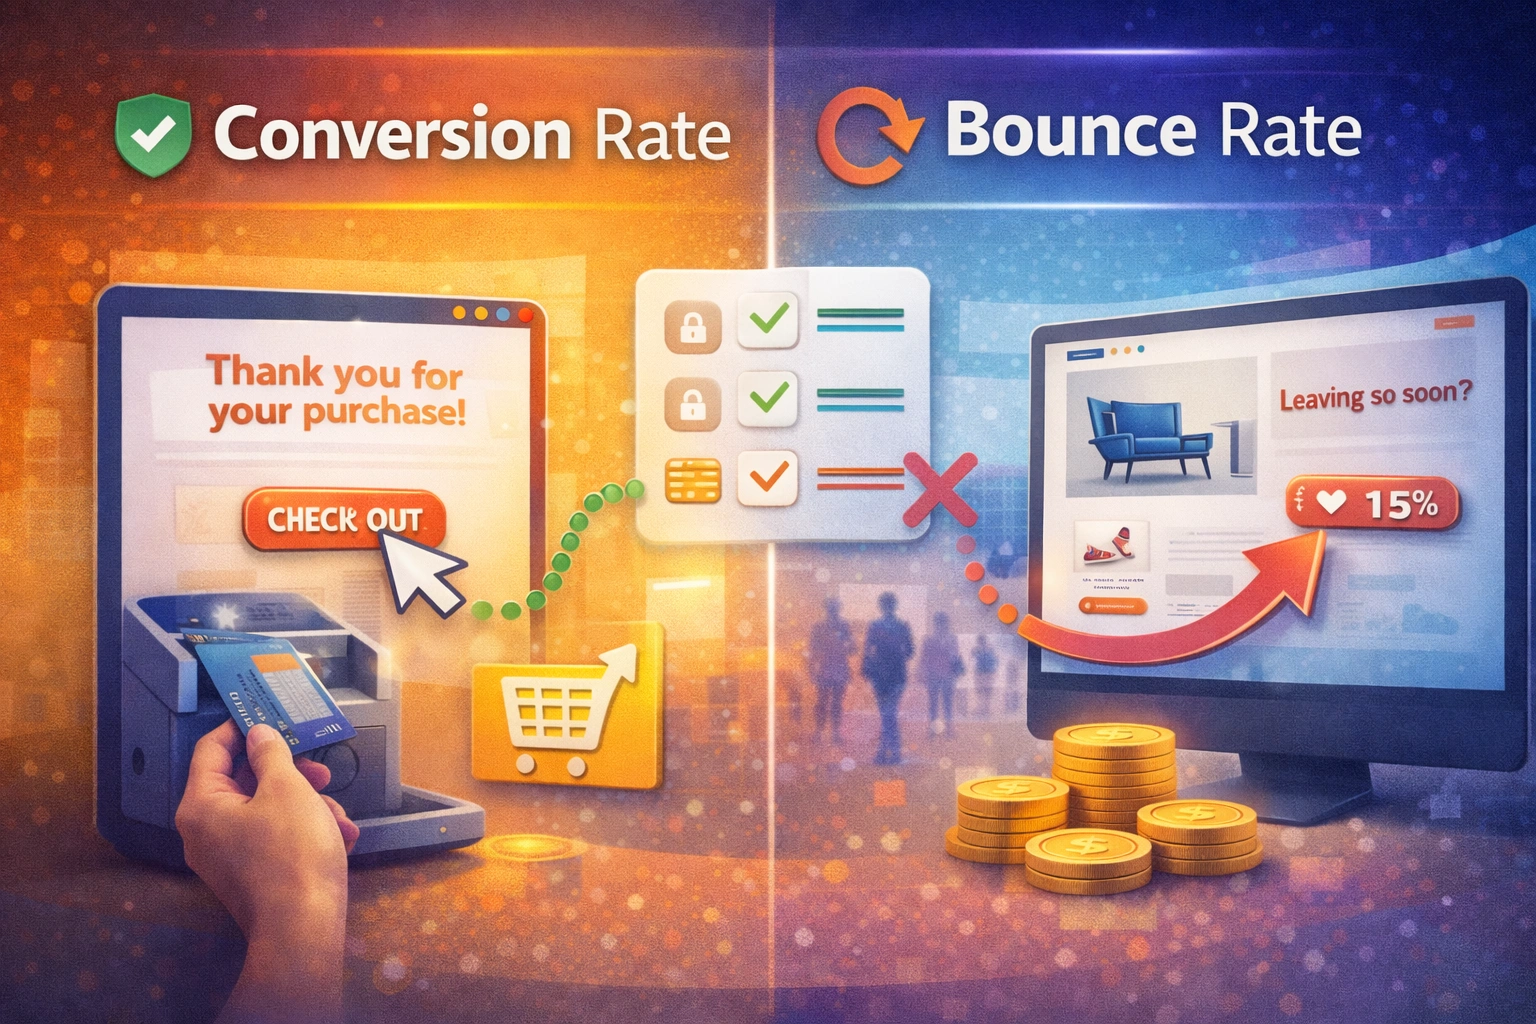
This metric evaluates the percentage of visitors who complete a desired action after interacting with your visual content, such as making a purchase or signing up for a newsletter. A robust conversion rate signifies that your visuals are not only attractive but also persuasive.
4. Bounce Rate
Bounce rate measures the percentage of users who leave your site after viewing only one page. High bounce rates may suggest that your visuals aren’t compelling enough to keep users engaged, prompting a deeper investigation into user experience and content placement.
5. Time on Page
This metric tracks the average amount of time users spend on a page before navigating away. Longer times often correlate with engaging content, while shorter durations may indicate that visual positioning needs improvement.
6. Social Shares
Analyzing how often your visual content is shared on social media can highlight its appeal and relevance. High social share rates typically point towards resonance with your audience, indicating strong visual positioning.
Tools for Measuring Visual Positioning Metrics
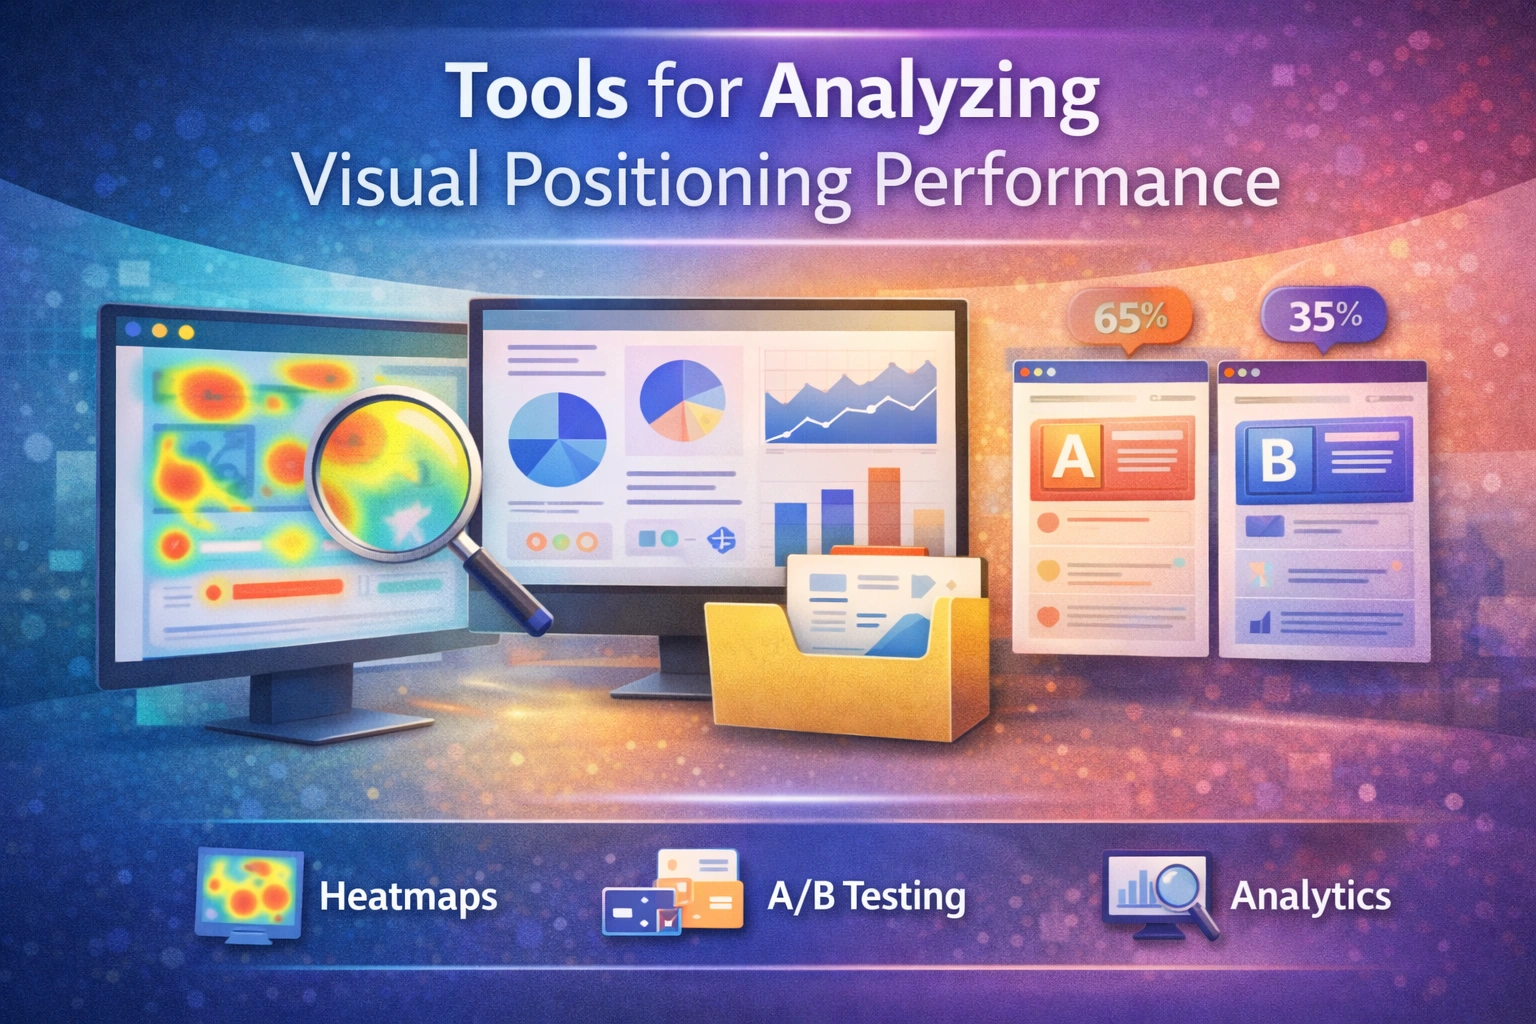
Several tools are available for monitoring and analyzing visual positioning performance metrics:
·
Google Analytics: A comprehensive tool for tracking website traffic and user behavior.
·
·
Hotjar: Offers heatmaps and session recordings to visualize user interactions with your content.
·
·
Canva: Canva Pro provides insights on engagement based on user interactions with your visuals.
·
·
Buffer: A social media management tool that tracks engagement metrics across various platforms.
·
Best Practices for Analyzing Visual Positioning Metrics
To effectively analyze visual positioning performance metrics, consider the following best practices:
1. Set Clear Goals
Before diving into analysis, it’s imperative to define clear objectives. What do you want to achieve with your visual content? Understanding your goals will guide your analysis and allow you to track relevant metrics.
2. Regularly Monitor Metrics
Consistency is key. Regularly reviewing your performance metrics ensures you stay informed about trends and can quickly identify issues or areas for improvement.
3. Contextualize Your Data
Data without context can be misleading. Compare metrics against past performance, competitors, or industry standards to derive meaningful insights.
4. Conduct A/B Testing
A/B testing involves creating two variations of a visual element and measuring their performance. This method is highly effective for understanding what resonates best with your audience.
5. Iterate and Optimize
Use your findings to refine your visual positioning approach. Continuous iteration based on metric analysis ensures your strategy remains effective and relevant.
Case Studies: Effective Visual Positioning
To better understand how to apply visual positioning analysis, let’s explore two case studies:
Case Study 1: E-commerce Brand
An online fashion retailer analyzed its visual content across social media platforms. By tracking engagement rates and CTR for various product images, the brand identified that lifestyle images performed significantly better than product-only shots. Utilizing this data, they shifted their visual strategy towards more lifestyle-focused imagery, resulting in a 25% increase in engagement and a 15% boost in conversion rates.
Case Study 2: SaaS Company
A SaaS company monitored the performance of its tutorial videos. An analysis revealed that videos under two minutes had significantly higher completion rates and engagement compared to longer formats. Based on this insight, the company shortened its videos and improved its bounce rates by 20%, enhancing user satisfaction and onboarding efficiency.
Conclusion
Analyzing visual positioning performance metrics is not just a useful practice; it's essential for businesses looking to enhance their visual strategies. By understanding and leveraging these metrics, organizations can improve engagement, boost conversions, and optimize their overall visual content. Remember, effective visual positioning requires ongoing analysis, testing, and adaptation. By continuously refining your approach based on data, you can ensure that your visual content not only captivates your audience but converts them into loyal customers.
For businesses seeking to improve their visual content capabilities, exploring high-quality visual positioning solutions is a fundamental step.
Explore our high-quality Visual Positioning UV printers here to discover the technology that can elevate your visual capabilities.
FAQ
What are the most important visual positioning performance metrics?
The most important visual positioning performance metrics include engagement rate, click-through rate (CTR), conversion rate, bounce rate, time on page, and social shares. Analyzing these metrics can provide valuable insights into the effectiveness of your visual content.
How often should I analyze visual positioning performance metrics?
Regular monitoring is recommended, ideally on a weekly or monthly basis, depending on the volume of your visual content. This frequency will help you stay updated on trends and make timely adjustments to your strategies.
What tools can I use to track visual positioning performance metrics?
Some popular tools for tracking visual positioning performance metrics include Google Analytics, Hotjar, Canva, and Buffer. These tools can provide insights into user behavior and engagement with your visual content.
How can I improve my visual positioning strategy?
You can improve your visual positioning strategy by setting clear goals, regularly monitoring your metrics, contextualizing your data, conducting A/B testing, and optimizing your content based on findings. Continuous iteration based on data insights ensures that your strategy remains effective.